= GCSE RESULTS =
(Percentage of pupils achieving 5 passes
of A*-C)
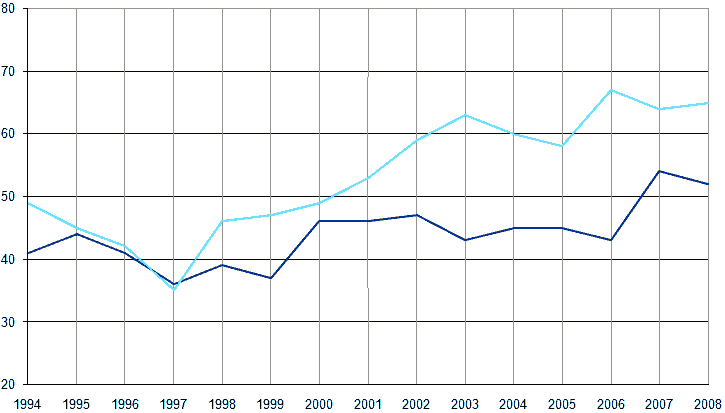
WALES HIGH
SCHOOL
DINNINGTON COMPREHENSIVE SCHOOL
= GCSE RESULTS =
(Percentage of pupils achieving 5 passes
of A*-C)
WALES HIGH
SCHOOL
DINNINGTON COMPREHENSIVE SCHOOL
Since records
began,
Wales has dominated the GCSE game. In the late Forster
years, the two schools were pretty indistinguishable, and in 1997, DCS
actually managed to outperform its rival when Wales curiously slumped.
But since then, Wales has taken off into giddy stratospheres. DCS
struggled
noticeably in the years directly following the fire. But with the
arrival
of Mrs Nicholson and the new
Lower
School, the pre-fire levels have been regained, and a pretty flat line
of performance has existed since the millennium. In 2007, this shot up
to its highest level yet, though still behind Wales, but in 2008 the
gap was widening again.
= A-LEVEL
RESULTS
=
(Average points per candidate)
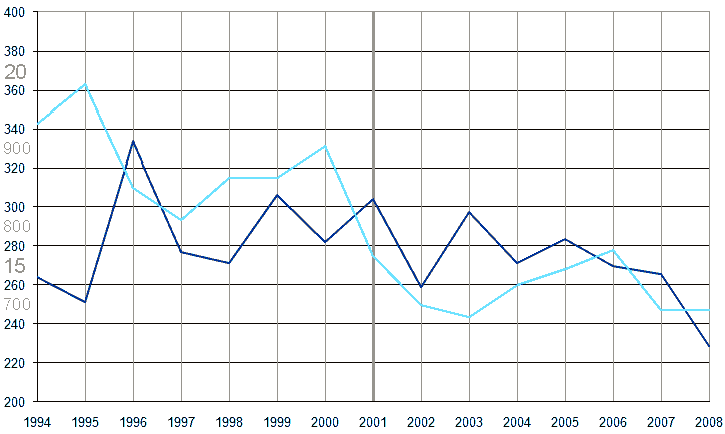
WALES HIGH
SCHOOL
DINNINGTON COMPREHENSIVE SCHOOL
Important Note: The way in which A-Levels are scored has changed twice since records began: From 1994-2001, the average score was around the 15 mark. Between 2002-2005, the scoring was around the 300 mark, and from 2006, lots of non-GCE exams are included to bump the scoring up to around 800. In the above chart, I've stuck the three systems onto the same graph, with a fairly simple ratio in operation for each. As such, little or nothing should be read into the slump between 2001/2.
DCS has had more luck in the battle of the 6th Forms, although this was not always the case. Mr Standring had only one moment of triumph, when DCS recorded a magnificent high in 1996. Other than this one blip, Wales clearly dominated the '90s. Mrs Nicholson had been at the school two years, and Mrs Morton had been in charge of the 6th Form for three years when DCS finally took the higher ground, in the year before the scoring system first changed. But it should be noted that it was a slump from Wales rather than an advance by DCS that kept the latter in the dominant position throughout the early '00s. It seemed an established rule that Wales were better for GCSEs and Dinnington for A-Levels, but 2006 wielded the proverbial spanner, to put Wales ahead in both pre- and post- 16 education. This seemed a short-lived aberration, with DCS back in its rightful place the following year, but in 2008 Wales took the lead again as Dinnington's score plummeted shockingly to its lowest position since records began being scored the way they are.
You will notice
that
Dinnington's line is amazingly saw-toothed. It would be interesting to
know if there is any reason why odd numbered years tend to fare better
than even
ones.
= INTER-SCHOOL SPORTS =
Martin Brown writes on the subject of
DCS
v Wales rugby: "We didn't know why it was so contested at rugby
until
our second year, when we were told that the PE dept amongst other
teachers
that were connected with rugby (such as CJ
Hall) always had big wagers on the outcomes with the Wales staff.
So
you got double the grief if you lost."
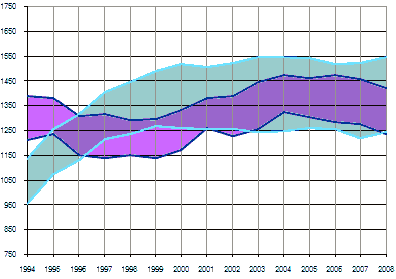
= SPECIAL NEEDS =
 |
The graph left
shows the growth
in the number of 'special needs' students at each school. The
bottom
lines indicate those pupils with SEN statements or 'School Action Plus'
status. The top lines represent that figure plus 'non-statemented' or
plain
'School Action' special needs pupils. There has, on the whole, been
little
difference between the two establishments in the number of statemented
pupils on the roll. But Wales has, for the most-part recognised a much
larger proportion of non-statemented special needs pupils, kicking off
in 1995 when DCS didn't recognise any. It is interesting, and perhaps
somewhat
shocking, to note the dramatic rise in special needs students at DCS in
2006, including a massive 144 pupils with School Action Plus
statements.
It should be pointed out that this increase was reflected in those
taking
their GCSEs: only 1 statemented pupil was included in 2005's results,
compared
with 25 in 2006! How much this increase was due to a genuine growth in
the
intake of special needs pupils year on year, or due to improved
'diagnosis'
and/or the arrival of the new School Action system, is unclear from the
statistics. It is possible that such numbers had a knock-on effect on
the exam results, although special needs pupils are entitled to extra
time
and certain other considerations. Whatever the case, 2007 showed a
dramatic decrease in statemented pupils at both establishments, back to
a late-'90s level. DCS maintained this level in 2008 while Wales
skyrocketted to new highs on both tallies. |
= POPULATION =
| This graph shows
the number
of pupils at each school. The bottom lines indicate those pupils of
compulsory
school age, while the top lines add on the post-16 rolls. Initially,
DCS
had the largest populations, but in 1996, perhaps as a result of the
publishing
of the first league tables, Wales drew pretty-much level. The following
year, with the Lower School fire possibly playing a part, Wales
overtook
DCS on both counts. By 2001, Dinnington recovered its previous form,
and
has since been largely stable alongside Wales. It is perhaps of
interest,
given the league table results, that for the last few years Dinnington
has had the higher compulsory population, and Wales the larger 6th Form
(Dinnington's post-16 roll is only ¾ the size of that of Wales).
The suggestion of this recent trend is that the smaller populations
yield
the better results haul. It cannot be denied that the population of
Wales
has increased dramatically since the arrival of league tables in 1994
(I
don't know of any changes to the Wales catchment, though it's
possible),
but the degree of this population shift seems to have plateaued.
Evidently
a similar proportion of Dinnington catchment pupils are enrolled at
Wales
each year (with presumably little return) to maintain the current
balance
of population. In 2008, for the first time since 2002, Dinnington had a
compulsory roll below that of Wales. |
 |
= TRUANCY =
 |
Finally, here's a
graph comparing
the number of half days missed through unauthorised absence in each
establishment. Dinnington records a good double that of Wales, although
there may be differences in the way the two schools record their data.
1999, the year Mrs Nicholson took over, shows a shocking high for DCS,
though she seems to have checked it pretty swiftly. 2006 saw the levels
increase again, and here is another clear saw-tooth of a graph. We
noticed
earlier how odd numbered years yielded better A-Level results. Here we
see that they also give lower rates of truancy. The two are not
directly
related as truancy figures are only recorded for pupils in compulsory
education.
But perhaps they are symptomatic of something else. It should be stated
however that there is no such obvious trend in the GCSE results (if
anything
even years come out the best). It is clear that in recent years, Wales has noticed a steady rise in its truancy rate, and is slowly beginning to catch DCS up. But it still has a way to go yet. A look at the A-Level graph will tell you how much the compilers of these stats love to tinker with the raw data to make it all the more difficult for the likes of me to keep a running progress report. This year it's the truancy data that's undergone a change: unauthorised absence is now no-longer listed and so I have had to create a somewhat arbitrary index with which to derive unauthorised absence from the still listed total absence tally. So this year's figures are not as accurate as usual. They are, none-the-less, roughly correct, and show a closing up of the wagging gap. |
= CONCLUSION =
Both schools are in similarly rough ex- pit-villages, and both catch two or three comparatively posh rural hamlets, so there's no great demographic difference through which we might seek out any circumstances of mitigation. Wales is universally superior in producing GCSE results, while Dinnington's 6th Form has held the upper hand on the A-Levels since the turn of the millennium. As of 2007, both schools are performing below the national average on both GCSE and A-Level results. Wales performs above the local average on GCSEs, while Dinnington performs above the local average on A-Levels.
Wales' greatest
dominance over DCS in recent years has come not so much in results as
in PR. Nary a week went
by in the mid-2000s that Wales weren't in the Trader or Guardian:
"Wales pupils celebrate
getting their homework marked" declared the headline, as glamourous
teenagers
beamed out of the quarter-page photograph. Their publicity machine has
been fantastic.
As I wrote the original imprint of this page, their headmaster was on
Newsnight,
questioning the Prime Minister. By way of contrast, DCS's highest TV
billing
in recent years was probably the meningitis epidemic of the mid '90s
that
got us onto News at Ten. Even when the school burnt down, all we could
muster was second billing on the local news, behind the plight of a
butch
transsexual. That said, DCS did get on "Beat the Teacher" back
in
the late '80s (Does anyone know who the contestants were?).
In GCSE terms at
least, both schools were pretty level before the days of the league
tables. Wales's slight and somewhat negligible upper-hand at that
crucial period (and perhaps also the massive arson problem at
Dinnington) was perhaps enough to kick off something of a "brain
drain", with a certain section of middle-class parent packing off their
children on the Kiveton bus to get a better education. If we assume,
quite arbitrarily, that the sort of parent that would do this is also
the sort of parent that has at least cared enough about their
children's education as to give them a book or two and coach them in
sums, then transferring such kids to Wales is going to have an effect
on DCS. It ultimately becomes a self-fulfilling prophecy: the more
fairly smart kids get packed off to Wales, the lower the ratio of
bright to thick (to put it in unfairly crude terms, for simplicity) at
DCS. So naturally, DCS does less well as a percentage result in its
GCSEs. Of course, those brighter kids that do go to DCS, having got their
decent GCSE grades, then find themselves in a smaller 6th Form and are
able to benefit, therefore, from closer tuition; hence the better
A-Level results at DCS. The influx of parentally pressured pupils into
Wales kicks up their GCSE percentage, and indeed their population, and
this population continues through to the 6th Form, where class-sizes
perhaps take their toll on some of the students, leading to a
marginally lower A-Level score for Wales. To what extent this trend
continues into the future remains to be seen; Dinnington has
re-established its compulsory population over Wales since 2003, which
may well lead to bigger classes and poorer results, or it may be an
indication that inter-catchment migration is reducing, in which case
the two schools may begin, once more, to level off and match each other
again on academic achievement.